Case Study
Environmental Monitoring & Water Telemetry
Analytical dashboard using public environmental and hydrological data.
Overview
Power BI and Alteryx project integrating IGAM and ANA data for environmental indicators, water telemetry, seasonality and executive visualization.
Challenge
Public datasets were scattered across multiple formats and structures, making integrated analysis between environmental quality and water behavior difficult.
Solution
An ETL pipeline in Alteryx, dimensional model and executive Power BI dashboard were developed with KPIs, trends and thematic navigation.
Impact
- End-to-end integration of multiple public sources
- Strategic environmental and telemetry indicators
- Demonstration of BI + ETL + executive storytelling
Tech Stack
Project Details
Environmental Monitoring & Water Telemetry Dashboard
🎯 Objective
Transform public environmental and hydrological data into strategic indicators and executive visuals for environmental monitoring.
🗂️ Data Sources
- IGAM — surface water quality
- ANA — flow, water level and rainfall
- CONAMA 357/2005 — environmental limit references
- DN COPAM/CERH-MG — additional state-level references
⚙️ ETL / Data Engineering
- ETL pipeline built in Alteryx Designer
- Download and preparation of public datasets
- Standardization of different columns and structures
- Consolidation of CSV, XML and spreadsheet files
- Fact table creation for Power BI
- Seasonal classification between rainy and dry periods
📊 KPIs
- Exceedance percentage
- Critical monitored points
- Parameters with higher non-compliance
- Temporal trends and seasonality
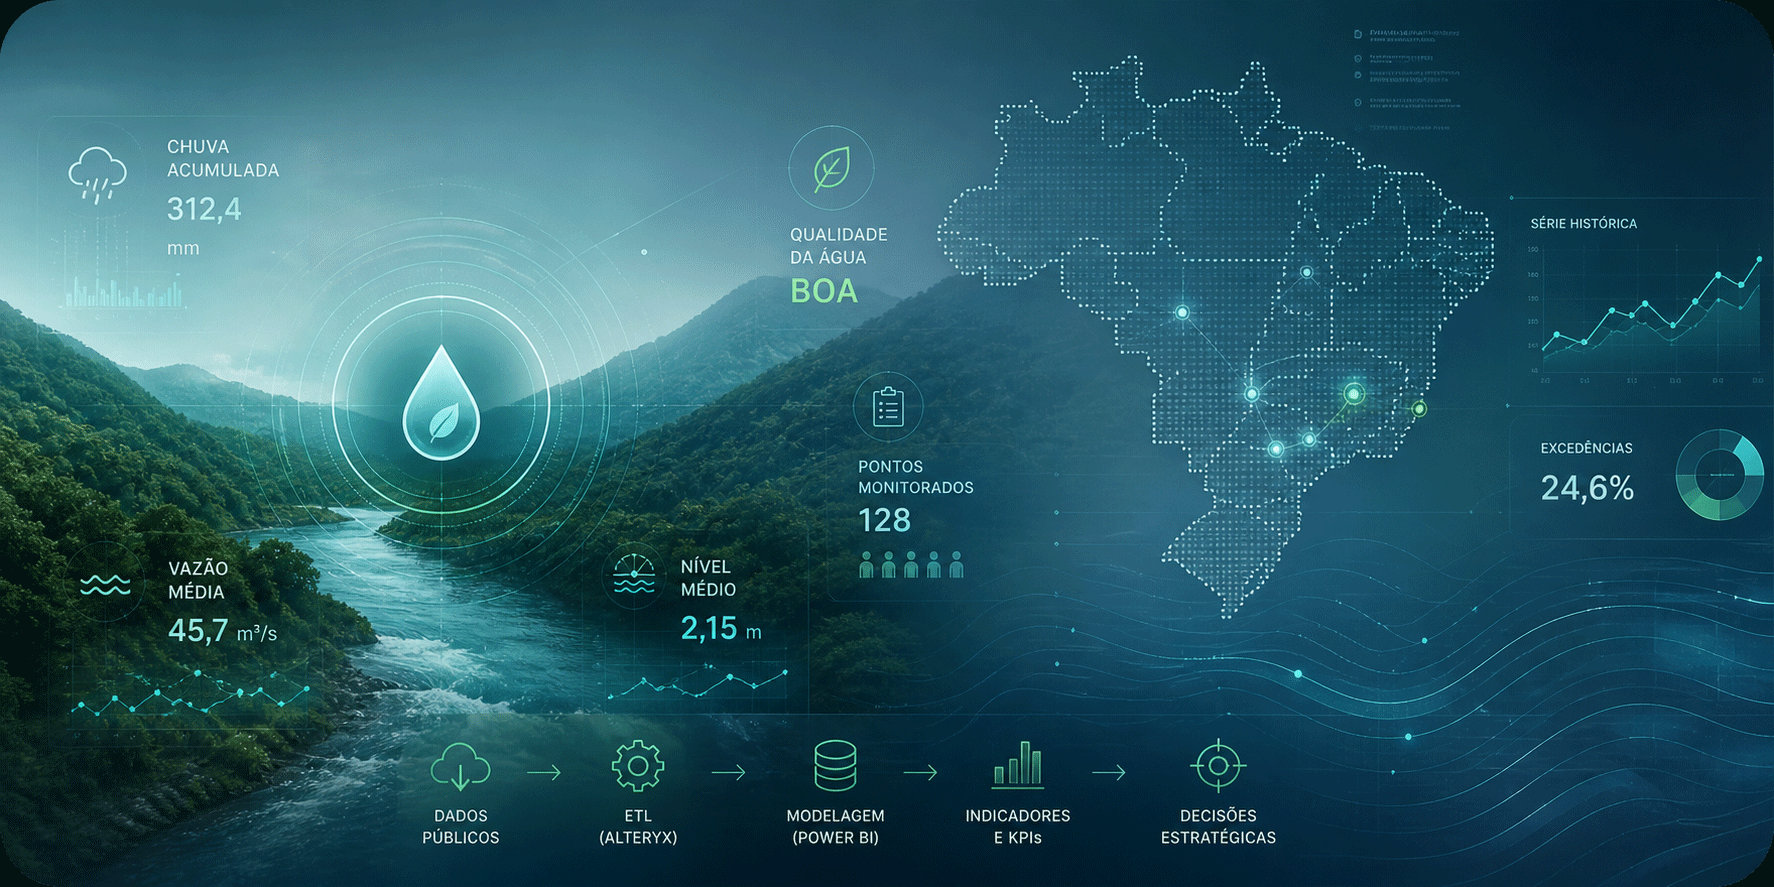
🌧️ Water Telemetry
- Accumulated rainfall
- Average flow
- Average river level
- Temporal correlation
📺 Power BI Dashboard
Interactive Power BI dashboard with thematic navigation, executive indicators and analytical visuals.
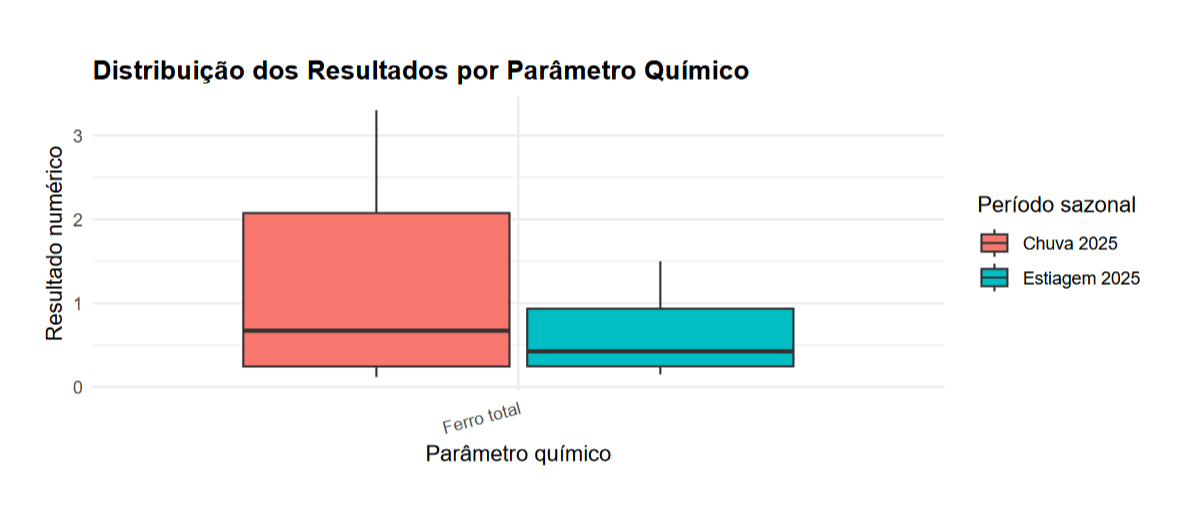
📈 R Visual
Because R visuals may not render correctly in the published web version, this section reserves space for a screenshot of the statistical visual used in the project.